QR Code Analytics: What Metrics Matter and How to Improve Scan Rates
You've created QR codes for your marketing materials, but how do you know if they're working? QR code analytics reveal exactly how people interact with your codes, helping you optimize placement, design, and calls to action.
In this guide, we'll cover the key metrics to track and actionable ways to improve your QR code performance.
Why QR Code Analytics Matter
Without analytics, QR codes are a black box. You print them, hope people scan them, and have no idea what happens. That's a problem because:
- You can't measure ROI on print campaigns
- You don't know which placements work best
- You can't optimize based on real data
- You're guessing instead of making informed decisions
Dynamic QR codes solve this by routing through a tracking URL that captures scan data before redirecting to your destination.
Key QR Code Metrics to Track
Total Scans
The most basic metric: how many times was your QR code scanned? This tells you overall engagement and helps you compare different QR code placements.
What to watch for:
- Sudden drops (code damaged or removed?)
- Spikes (successful placement or promotion?)
- Trends over time (seasonal patterns?)
Unique Scans vs. Total Scans
Total scans count every scan, including the same person scanning multiple times. Unique scans estimate individual users based on IP and device fingerprinting.
A high ratio of total to unique scans might indicate:
- Users scanning multiple times because the link didn't load
- Repeat engagement (good for loyalty programs)
- The same QR code being shared digitally (screenshot)
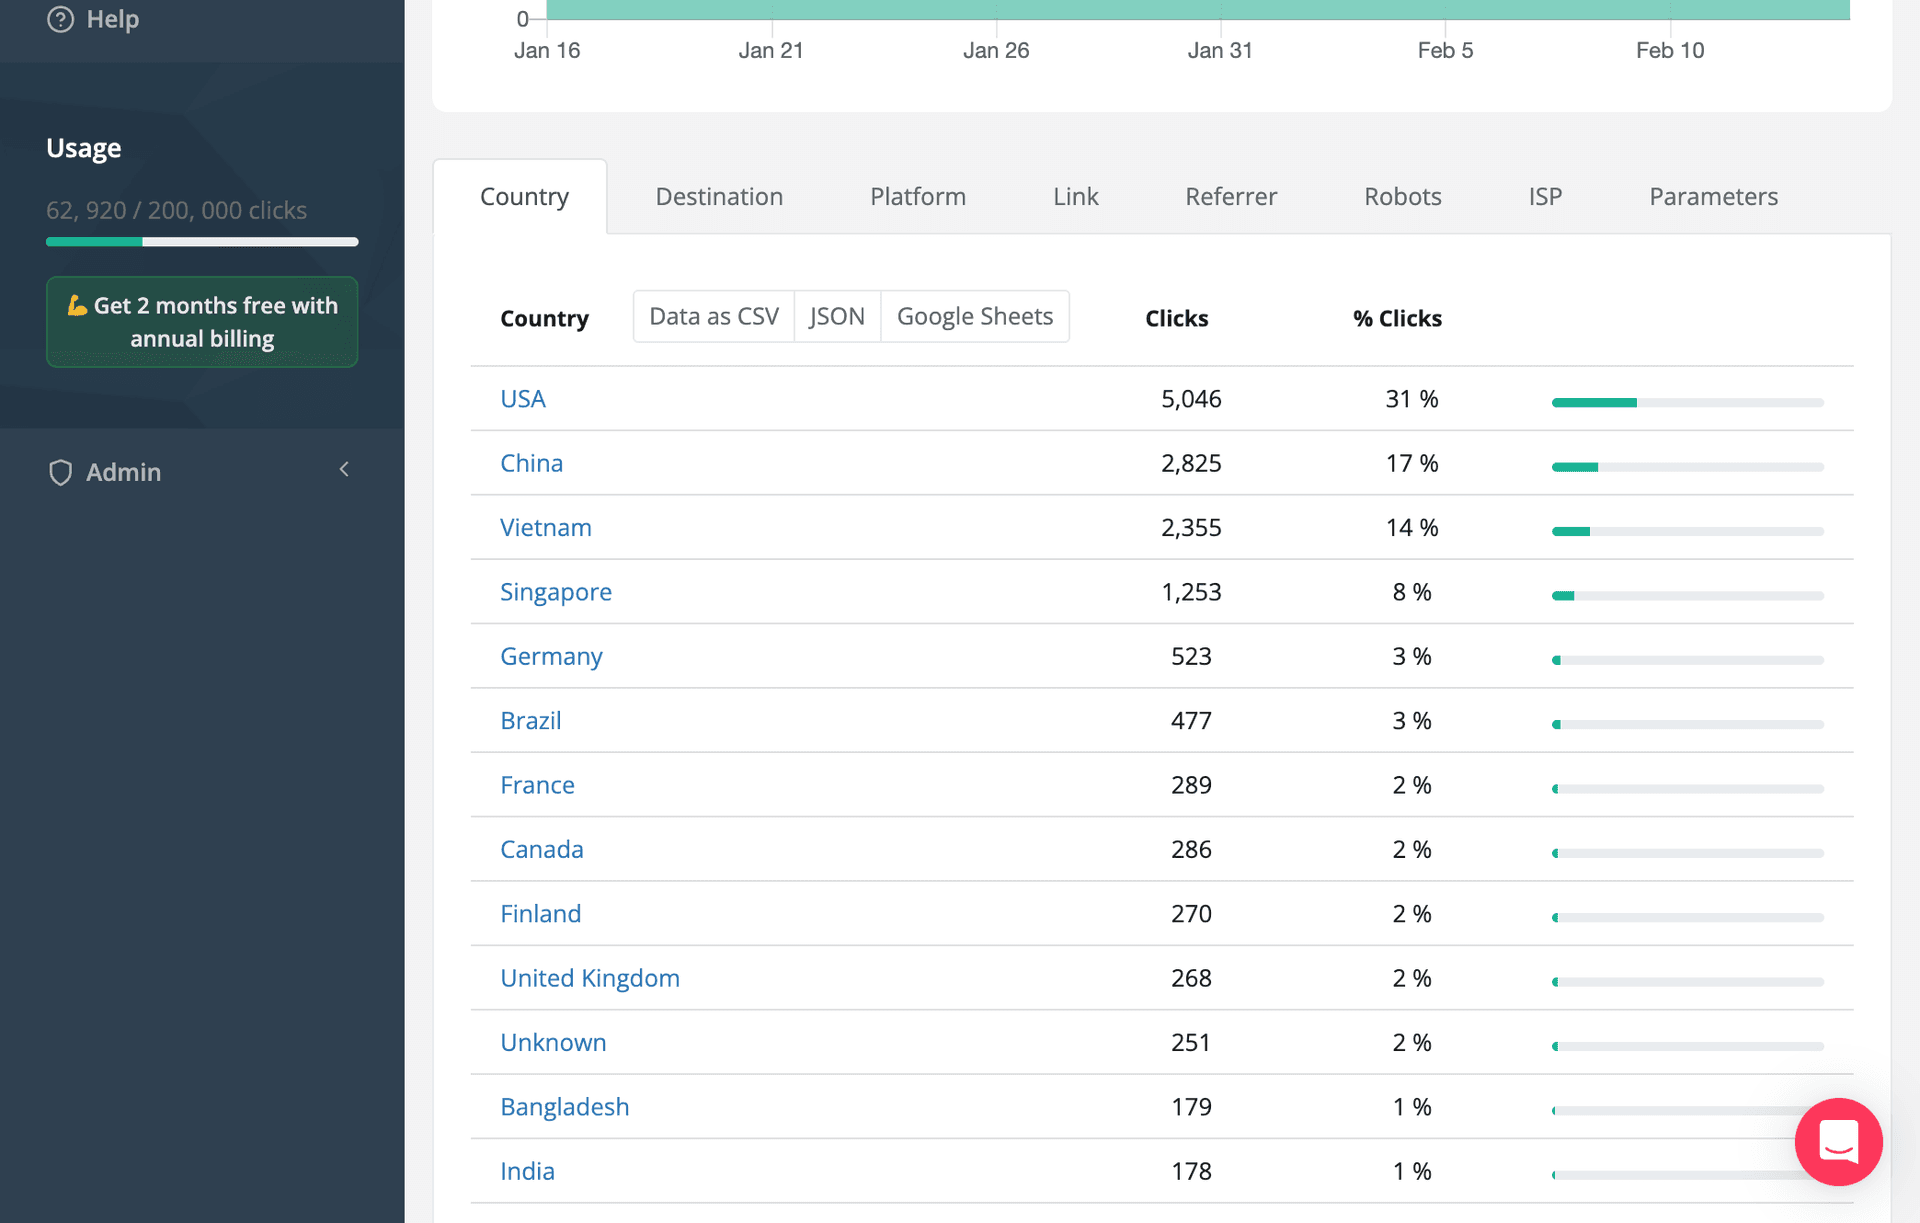
Scan Location
Geographic data shows where scans are coming from, down to city level. This is especially valuable for:
- Multi-location businesses: Compare performance across stores or regions
- Event marketing: Verify scans came from event attendees, not online shares
- Out-of-home advertising: Measure which billboard or poster locations perform best
Device Type
Understanding whether scans come from iOS or Android helps you:
- Optimize landing pages for the dominant platform
- Set up device-specific redirects if needed
- Identify technical issues (if one platform has higher bounce rates)
Time of Scan
When are people scanning your codes? This data helps you:
- Schedule staff or support during peak times
- Time follow-up campaigns appropriately
- Understand user behavior patterns
A restaurant QR code might see peaks at lunch and dinner. A product packaging QR code might spike on weekends when people have time to explore.
Referrer Data
While most QR scans show as "direct" (no referrer), this field can reveal when your QR code image is being shared online rather than scanned from print materials.
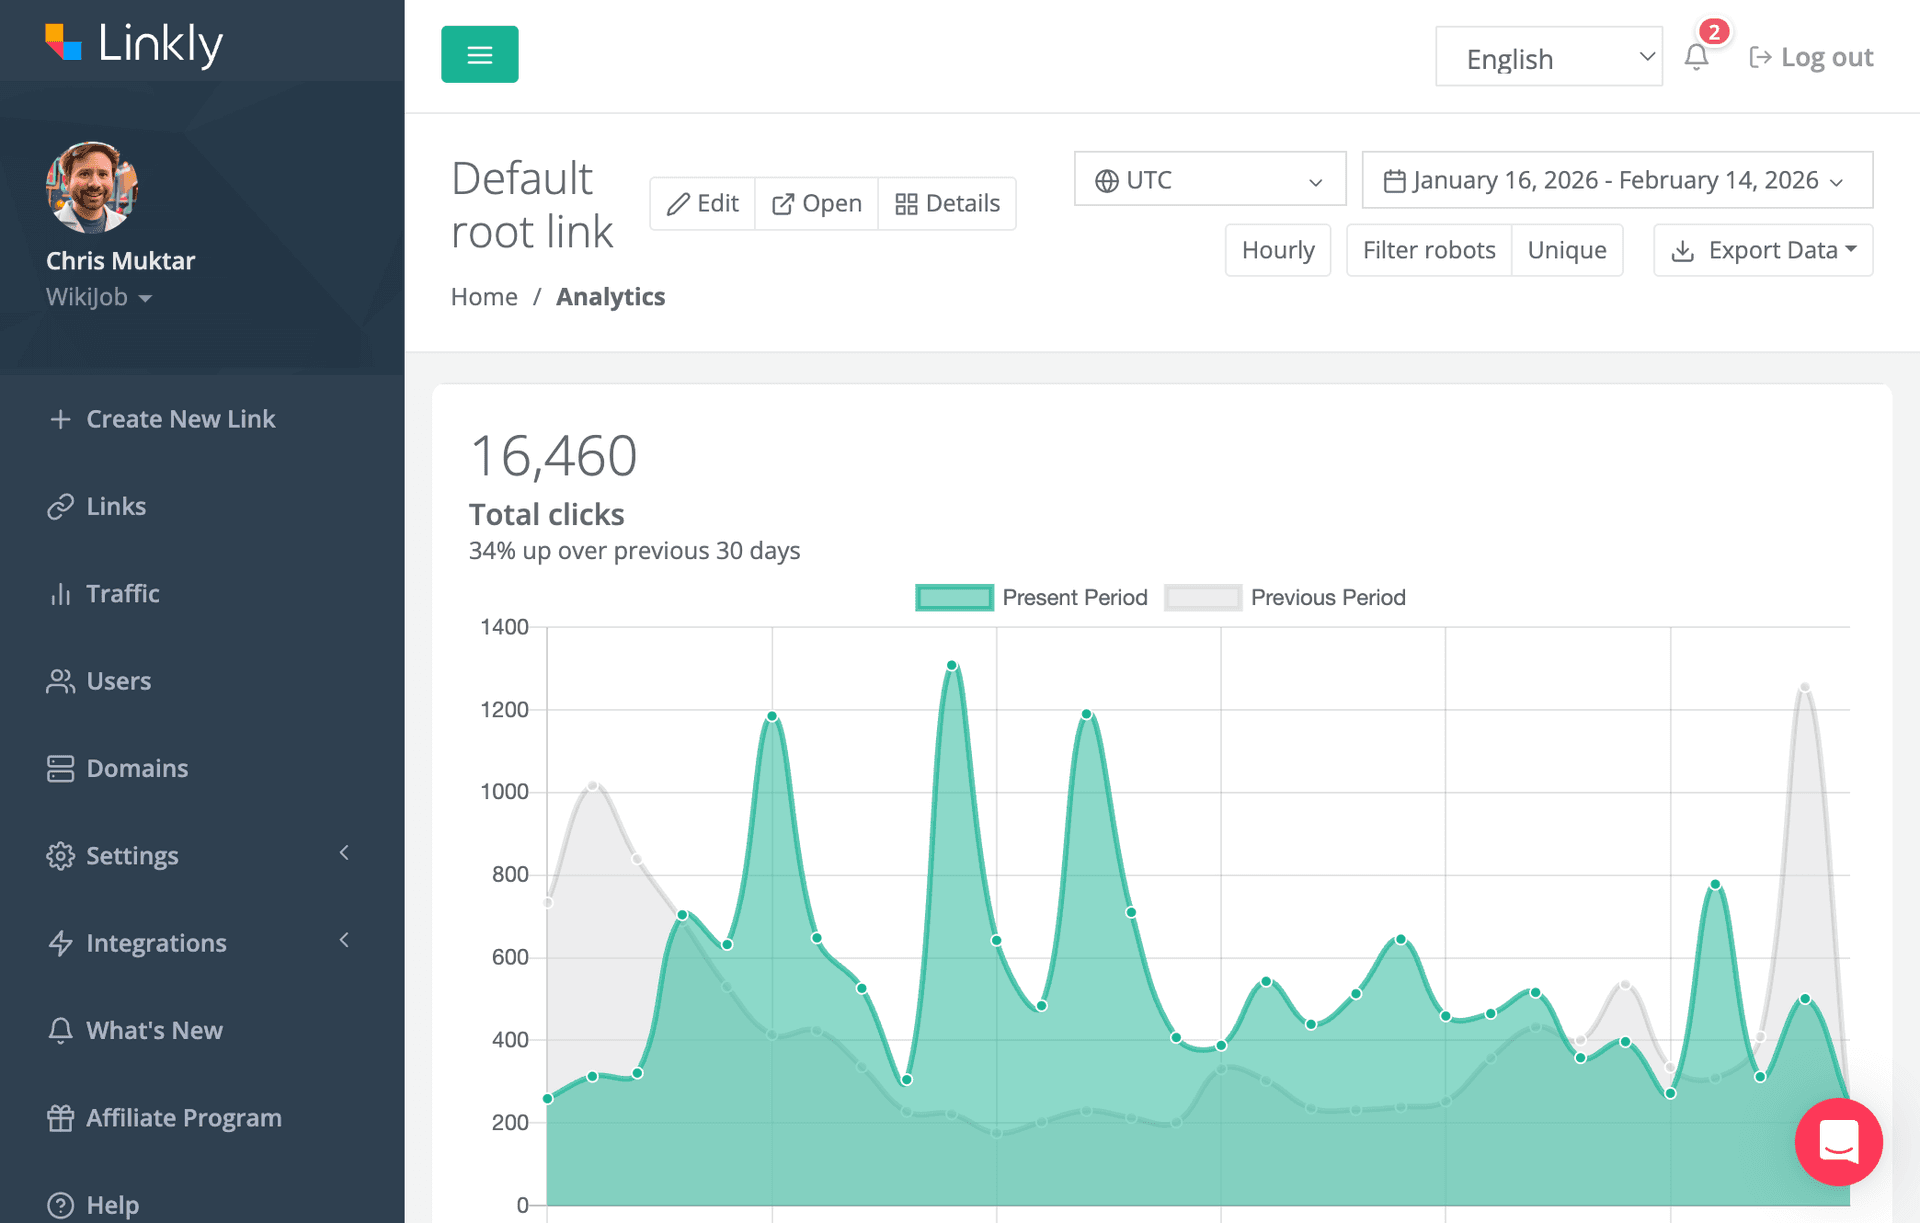
How to Access QR Code Analytics
In Linkly, every QR code is linked to a tracked URL. To view analytics:
- 1Go to your Linkly dashboard
- 2Find the link associated with your QR code
- 3Click to view detailed analytics
You can also export data as CSV for deeper analysis or integrate with your analytics tools via the API.
For a full overview, see our QR code analytics documentation.
Benchmarks: What's a Good Scan Rate?
Scan rates vary wildly based on context, but here are rough benchmarks:
| Placement | Typical Scan Rate |
|---|---|
| Product packaging | 1-5% of customers |
| Restaurant table tents | 10-30% of diners |
| Event badges/materials | 5-15% of attendees |
| Print ads (magazines) | 0.5-2% of readers |
| Billboards/posters | 0.1-1% of impressions |
| Direct mail | 2-5% of recipients |
Your actual results depend on the value proposition, call to action, and audience tech-savviness.
10 Ways to Improve QR Code Scan Rates
1. Add a Clear Call to Action
Never let a QR code stand alone. Tell people what they'll get:
- "Scan for 20% off"
- "Scan for the full menu"
- "Scan to watch the video"
Vague CTAs like "Scan me" dramatically underperform.
2. Size Appropriately
QR codes need to be large enough to scan from a reasonable distance. Minimum sizes:
- Table tent: 1 inch (2.5 cm)
- Poster viewed from 3 feet: 2+ inches
- Billboard: Calculate based on viewing distance
The formula: QR code size should be at least 1/10th of the scanning distance.
3. Ensure Adequate Contrast
The classic black-on-white provides the best scannability. If using brand colors, maintain high contrast between the QR modules and background. Test on multiple devices before printing.
4. Add Your Logo
A branded QR code with your logo looks more professional and trustworthy. Linkly's QR generator lets you add a centered logo while maintaining scannability through error correction.
5. Use Dynamic Codes
Dynamic QR codes let you update the destination URL without reprinting. This means you can:
- Fix broken links
- Update seasonal promotions
- A/B test different landing pages
- Redirect to fresh content
6. Optimize the Landing Page
A QR code is only as good as where it leads. Ensure your destination is:
- Mobile-optimized (most scans come from phones)
- Fast-loading
- Relevant to the promised content
- Easy to navigate
7. Place at Eye Level and Accessible Locations
QR codes placed too high, too low, or in awkward positions get fewer scans. Position them where people can easily reach their phone to scan.
8. Test Before Printing
Always test your QR codes on multiple devices before mass printing. Check that they scan quickly and lead to the correct destination.
9. Track Multiple Placements Separately
If you're placing QR codes in multiple locations, create separate codes for each. This lets you compare performance and identify your best placements.
Use link tags in Linkly to organize QR codes by campaign, location, or material type.
10. Combine with Retargeting
Add retargeting pixels to your QR code links. This way, you can follow up with scanners through digital ads, even if they didn't convert on the first visit.
Analyzing and Acting on Your Data
Review your QR code analytics regularly:
Weekly: Check total scans and any anomalies Monthly: Compare performance across codes and time periods Quarterly: Evaluate which placements to continue, expand, or discontinue
Use insights to inform future campaigns:
- Double down on high-performing placements
- Test new CTAs on underperforming codes
- Reallocate budget from low-scan to high-scan materials
Conclusion
QR code analytics transform your print and physical marketing from guesswork into a data-driven channel. By tracking the right metrics and continuously optimizing based on scan data, you can significantly improve the ROI of your QR code campaigns.
Ready to track your QR codes? Get started with Linkly and create dynamic QR codes with full analytics, custom branding, and the flexibility to update anytime.
Get 100 short links and track 500 monthly clicks for free.